Basic function
You will learn the basic function to enter data, select a chart type and specify the properties.
Chart type
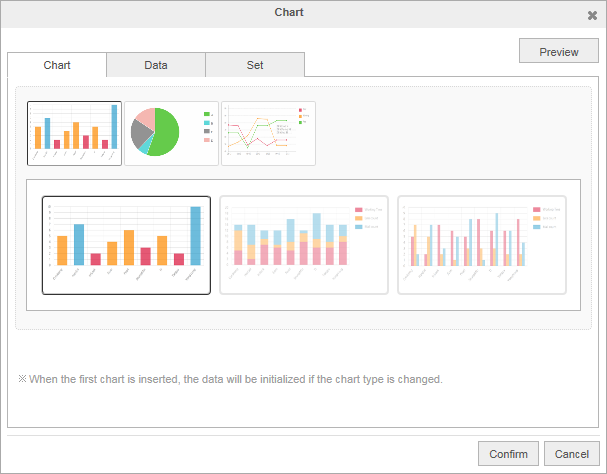
Select a chart type.
Determine the chart type.
Select the shape of the chart.
Select a chart type to see the detailed shape of the chart corresponding to the selected type.
![]() When you insert a chart for the first time, if you change the chart type, data will be initialized.
When you insert a chart for the first time, if you change the chart type, data will be initialized.
Chart data
To make a chart, you must have data. Enter data and make the following chart.
Select a chart type and the corresponding sample data will be shown by default.
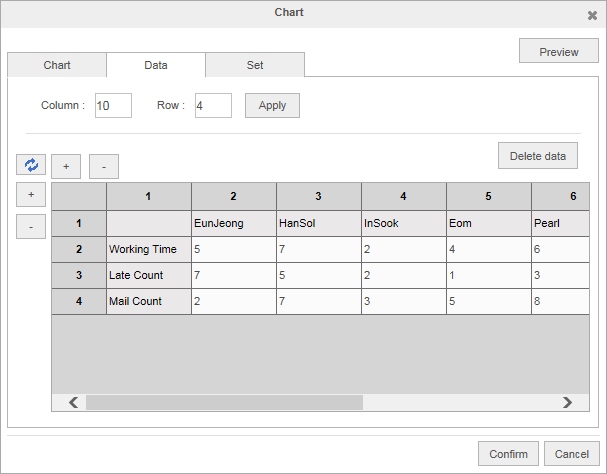
Row and column
When you specify the rows and columns of the data to enter, and press , the table containing the corresponding rows and columns will appear.
Enter data
Click a cell to enter data.
Press the "+" button to add a row or column depending on the cell selection position.
Press the "-" button to delete a row or column depending on the cell selection position.
 Press the button to transpose the data in the row and column.
Delete data
Press the Delete data button to delete all the data you entered.
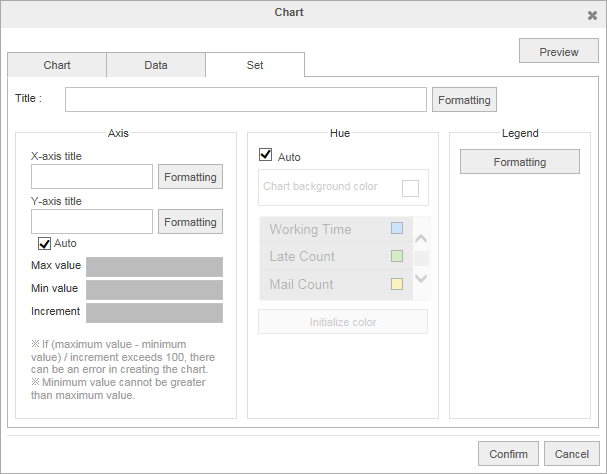
Chart properties
You can specify the chart title, data range and legend format.
[Axis]
Chart title
Enter the title representing the nature of the chart in the input box.
Press the button to specify the format for the chart title.
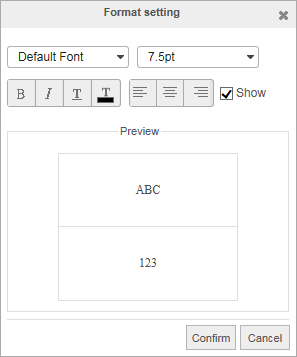
![]() Use the to specify the font, font size, bold, italic, underline and font color, and decide whether to align and show selected functions.
Use the to specify the font, font size, bold, italic, underline and font color, and decide whether to align and show selected functions.
Also, you can see your settings in the preview screen.
The title for the X-axis and the Y-axis
Enter the title for the X-axis and Y-axis.
Press the button to specify the title for the axis.
Set the data range
: When you deselect the automatic data range selection, which is selected by default, you can change the data range setting for the axis.
: Set the value of the end of the largest tick on the axis. This function is available only when the automatic data range setting is deselected.
: Set the value of the end of the smallest tick on the axis. This function is available only when the automatic data range setting is deselected.
: Set the increment of the main tick of the axis. This function is available only when the automatic data range setting is deselected.
![]() If (maximum value - minimum value) / increment exceeds 100, problems may occur in the process of making a chart.
If (maximum value - minimum value) / increment exceeds 100, problems may occur in the process of making a chart.
![]() You cannot enter a minimum value greater than the maximum value.
You cannot enter a minimum value greater than the maximum value.
[ Hue ]
The background color of the chart
You can specify the background for the entire chart. This function is available only when the automatic setting is deselected.
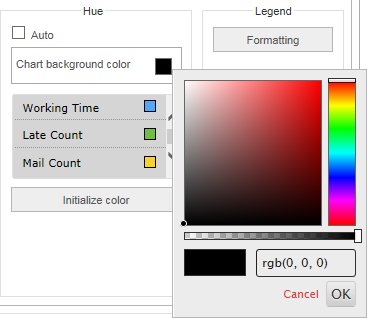
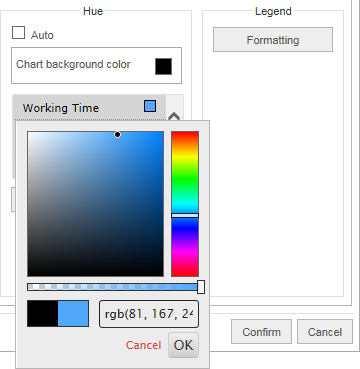
Data marking
You can specify the data marking color for selected data. This function is available only when the automatic setting is deselected.
Press the button to initialize the specified color.
[ Legend ]
Legend
Press the button to specify the format for the legend.
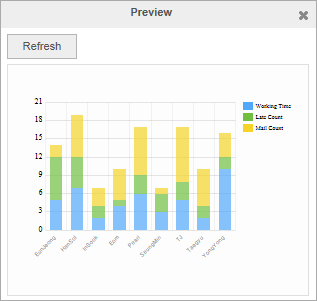
Preview
Press the button to display the screen reflecting the selected settings.
Press the button when a setting is changed to display the reset screen.
Copyright ⓒ 2019 JIRANSOFT Co., Ltd. All rights reserved.